Hello there!
Need Help? We are right here!
Need Help? We are right here!
Search Results:
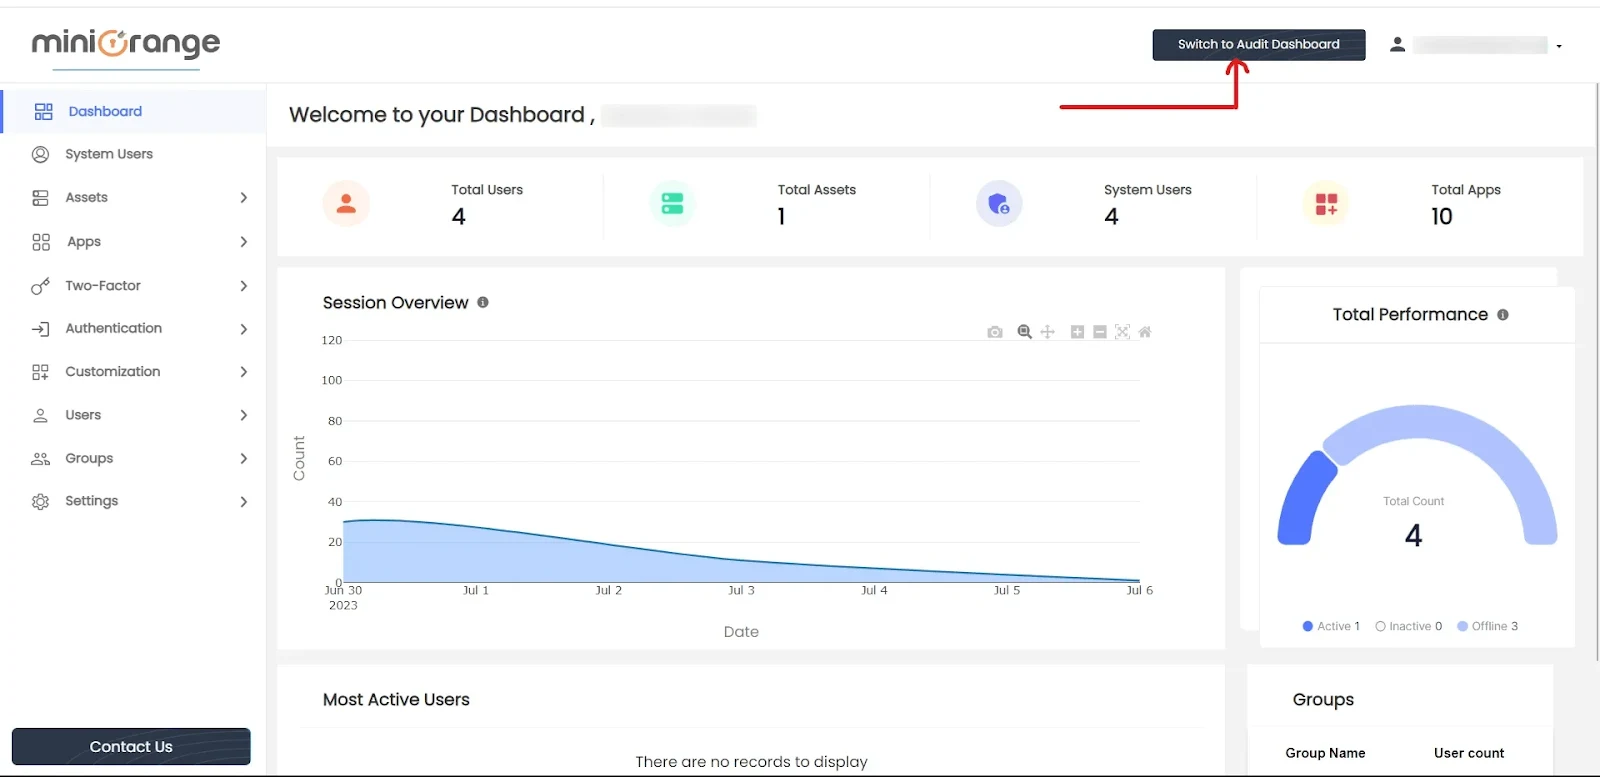
×Select the Switch to Audit Dashboard option located on the right side of the navigation bar, and you will be redirected to the Audit Dashboard.
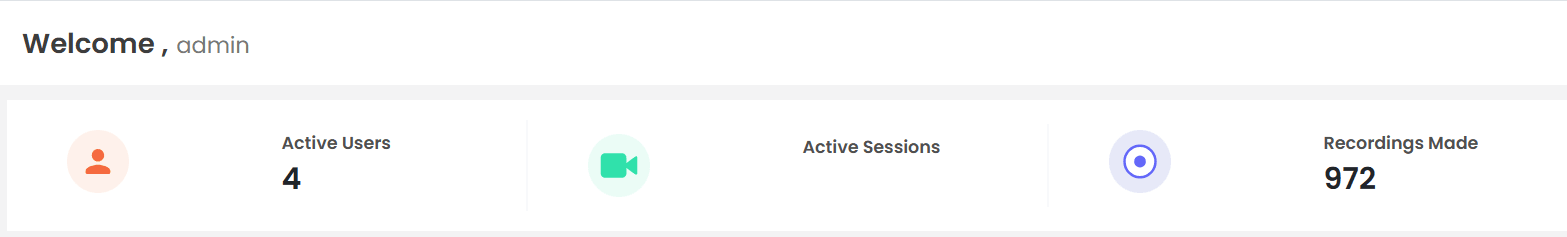
At the top of the page, the username of the logged-in admin is displayed in the welcome message. You can then see the active Users (count of logged-in users), Active Sessions (total tabs opened), and Recordings Made (count of captured recordings until now).
The primary page is further divided into 4 sections.
1. Resources Overview
This section features a bar graph illustrating the number of apps, web apps, and resources accessed within the last seven days. It provides an overview of app and resource usage and activity over time.
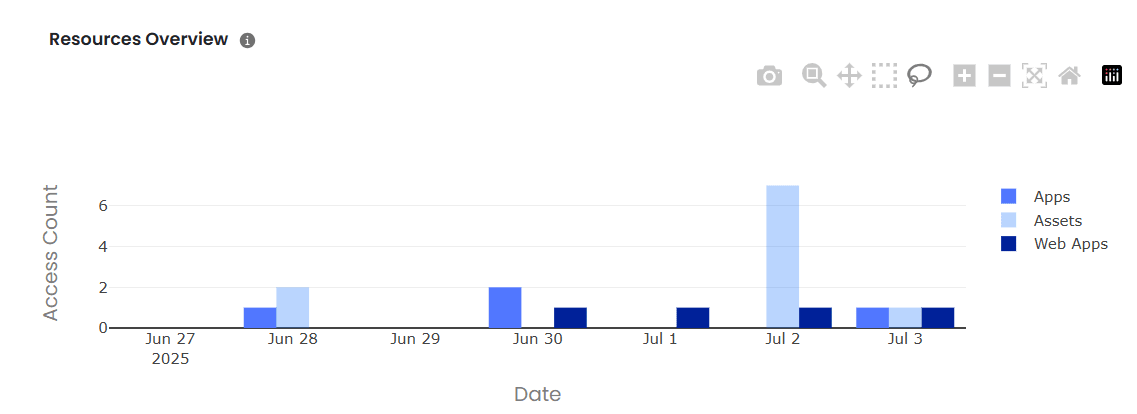
You can download the plot in PNG, zoom in and zoom out, box a particular bar, PAN in the graph, autoscale, and reset the settings.
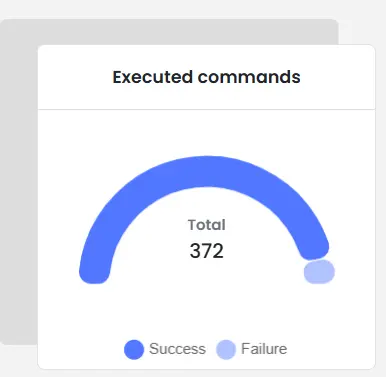
2. Executed Commands
This section features a semi-circle pie chart divided into two sections.
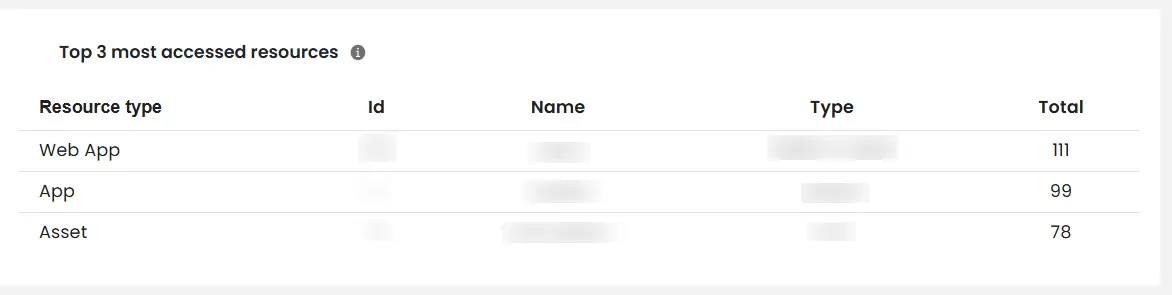
3. Top 3 most accessed resources
This section consists of a listing for the three resources that have been accessed the most. It highlights the most frequently utilized resources based on user activity.
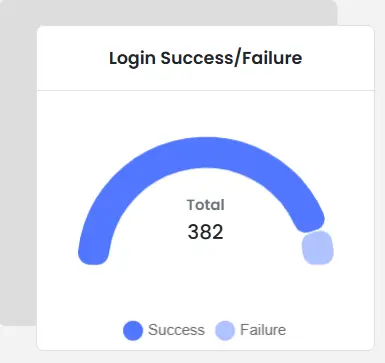
4. Login Success/Failure
This feature provides a semi-circle pie chart divided into two sections.